Cryptocurrency Portfolio Calculator
How to diversify a Cryptocurrency Portfolio
This article is a follow-up to the previous article that discussed if (and how much) you should invest in cryptocurrencies.
The general advice is to split your money evenly about as many (the more the better) cryptocurrencies (short “coins”) and that is indeed good advice. However, unless you’re doing this professionally, you don’t want to have 100 accounts at different exchanges in order to be able to buy all the coins that you found to be worth their (or your) dime.
So, assuming you only invest in a handful and you only have an account at one or two major exchanges, in which coins should you invest?
In this post I won’t answer which ones I think you should invest in. Maybe that’s a topic for another - highly subjective - post later on. Instead, I will explore what statistics has to say about it.
For this purpose I use data from Kraken and Poloniex to calculate a covariance matrix that we use to determine how a diversified portfolio should, or at the very least could, look like.
Covariance
The idea is to measure how similar two coins behave in price. If they behave very similar, you don’t diversify well by buying both because if one goes down so will the other. On the other hand, if they’re completely different beasts, the tanking of one might well be countered by the surging of the other. So in the case of a portfolio of two similar coins you are subject to roller coaster ride regarding your portfolio value. In the other case, you are … well forget that, investing in cryptocurrencies means riding rollercoaster. Period. But, the latter will make you want to puke less often. Now if that doesn’t sound like an attractive value proposition…
So, from a purely statistical perspective I just took the price movements of the last days and calculate the returns as follows:
With these returns I calculate the covariance as given here. Assuming two coins a and b with returns over the last n days:
and
are just the mean of the returns of the coins a and b.
Assuming we have more than 2 coins, we can come up with a nice little covariance matrix that looks like this:
$ = \begin{bmatrix} cov_{aa} & cov_{ab} & & cov_{ag} \ cov_{ba} & cov_{bb} & & cov_{bg} \ & & & \ cov_{ga} & cov_{gb} & & cov_{gg} \end{bmatrix} $
(Note that the covariance of one thing with itself is also known as the variance.)
Now what can we do with this?
Correlation
First of all, we can see how similar coin prices behave and, based on that, induce which coins are similar.
For this purpose we just transform the Covariance Matrix into a Correlation Matrix and display it.
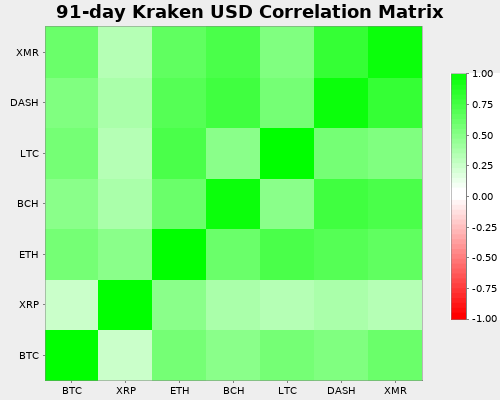
The following is the Correlation Matrix for the most recent 91 days (i.e., a quarter), as of March 1, 2018.
Since the diagonal entries are always 1 (a coin always correlates perfectly with itself), here’s a version where the diagonal elements are left out of scaling, so the colors can be distinguished a little more more easily.
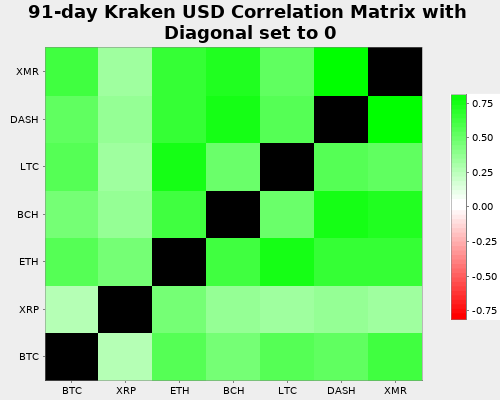
So what does Kraken say about coin similarity?
Well, you can see that basically all coins behave very similar (that’s because there was a big downturn) in the most recent days with the exception of XRP (Ripple). So you’re portfolio would be less volatile (read: risky) if you only invested in Bitcoin and Ripple as compared to, e.g., Bitcoin and Monero.
The general rule is: try to invest in currencies with little correlation between each other, otherwise the benefits of diversification are much weaker and you need to hold more coins to achieve the same degree of diversification.
Since the chart is arguably a little lopsided (quite green), let’s look at the same chart at Poloniex which is known to include more coins than Kraken. However, we cannot check the price against the US Dollar because Poloniex does not trade against fiat. So this time we plot against Tether (USDT), a semi-stable coin pegged against the US Dollar.
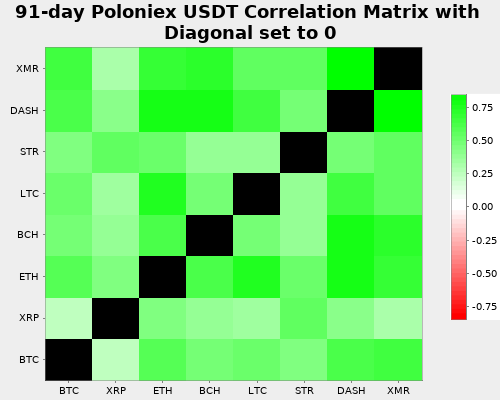
Here we see that also Stellar is dissimilar to the other coins.
Finally, let’s look at the Poloniex coin correlation during the last year because this will put less focus on the most recent downturn in coin prices and provide a more stable view of coin correlations:
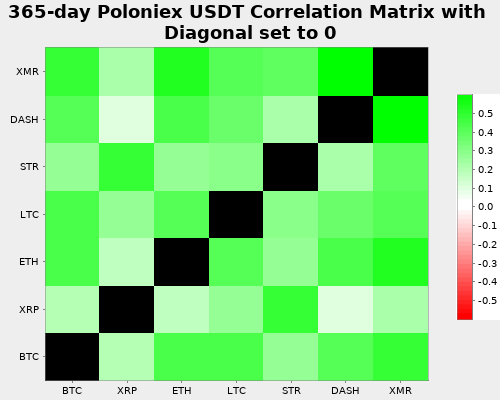
Reading that chart, I’d say that obviously we have two types of coins at play here:
- Ripple and Stellar correlate with each other. This makes sense because both are non-anonymous coins providing tools to improve existing banking infrastructure. In a way they are cooperative with banks and governments.
- Bitcoin and the others correlate with each other, since they are (semi-) anonymous coins, less used for banking, possibly used for illegal activities (not necessarily though) and they are much more an antithesis to the current banking system and governments.
Consequently, a prudent long-term investor might want to avoid exposure to only one of those clusters and instead seek to balance them.